Layers and Features
Dynamic Lands Labs’ geospatial and spatiotemporal analysis tools and algorithms, built on a custom codebase, enable in-depth study of LiDAR, multispectral satellite imagery, and other GIS datasets to extract meaningful, site-specific insights.
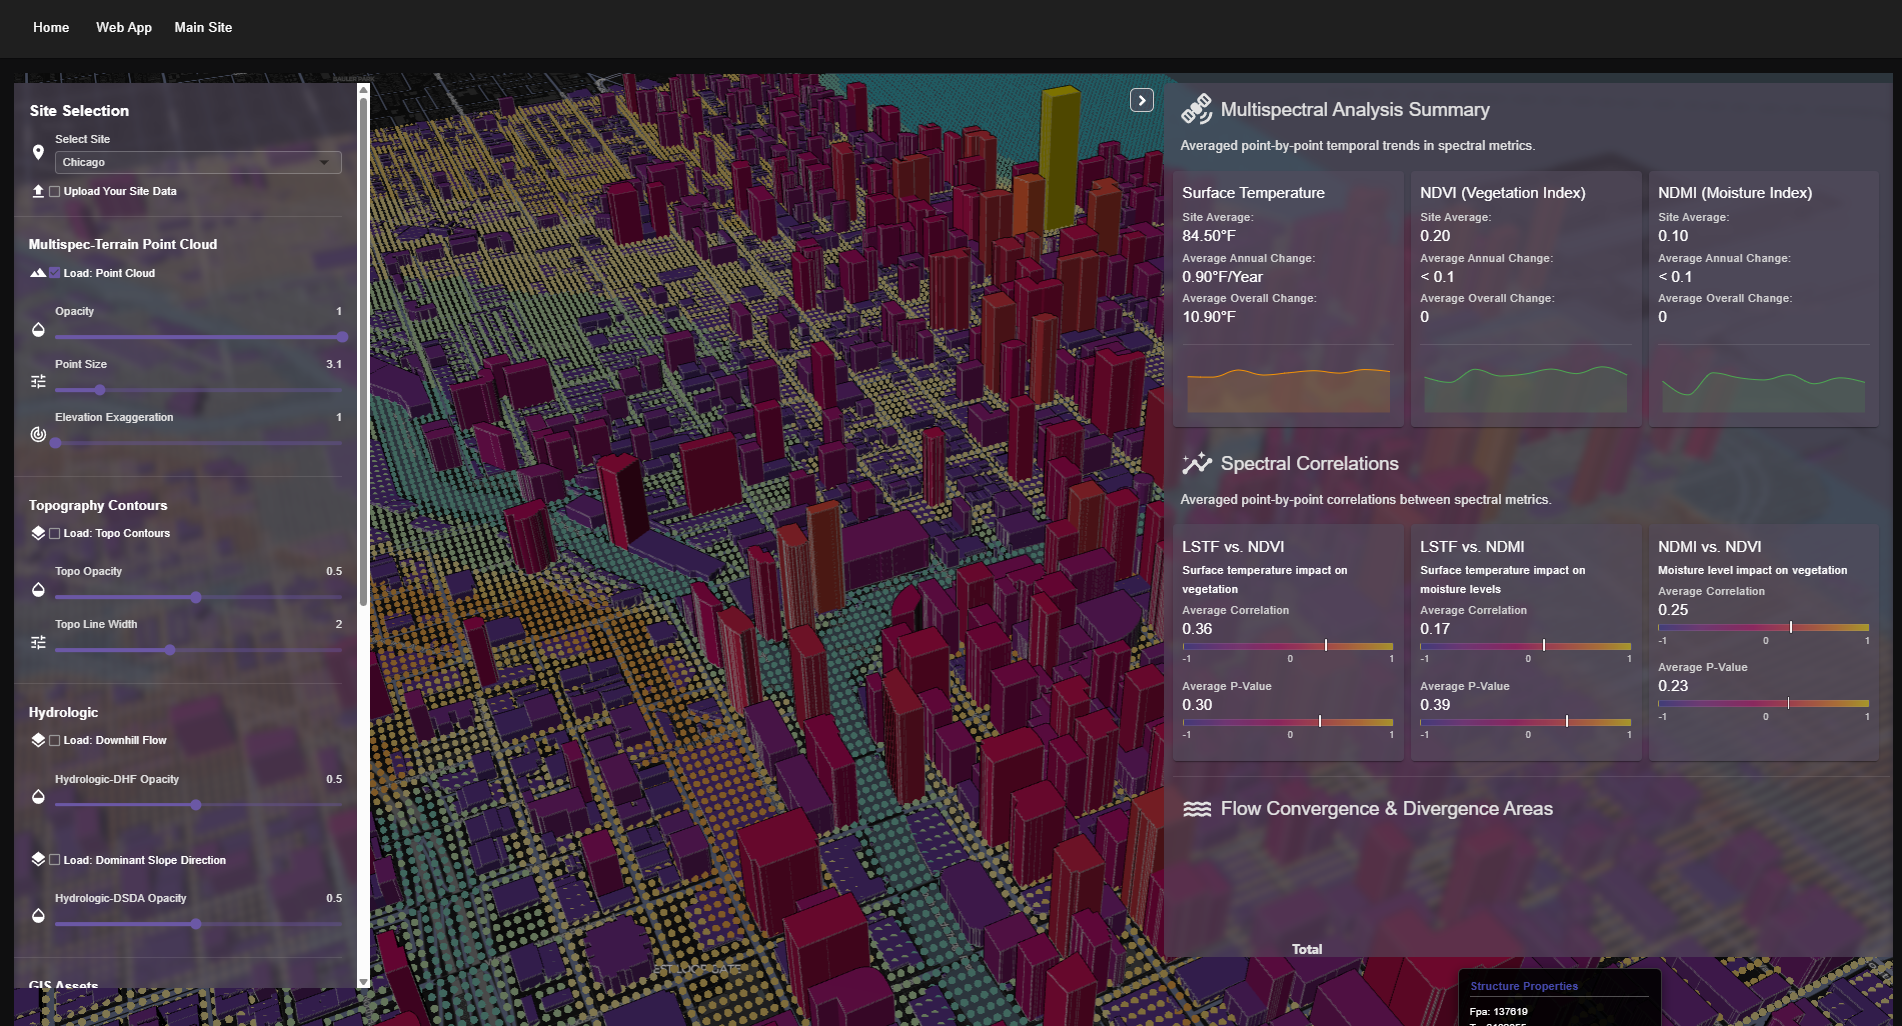
DLL delivers insights through interactive visualization platforms, allowing clients to upload, explore, and filter their processed data in an intuitive web environment.
For design professionals, DLL also has a suite of custom Grasshopper tools for Rhino, enabling seamless integration of analytical outputs directly into 3D design workflows—ideal for architects, landscape architects, and students seeking to connect environmental data with design intent.
Spectroscopy with Multispectral Satellite Imagery
Multispectral satellite imagery captures reflected energy across a range of wavelengths, and each band highlights different physical properties of the landscape. By combining these bands in specific ways, we can derive powerful spectral indices that reveal surface temperature patterns, vegetation health (NDVI), moisture content (NDMI), and even distinguish between different material types. These composite measurements allow us to translate raw pixel data into meaningful insights about site conditions, environmental performance, and surface characteristics.
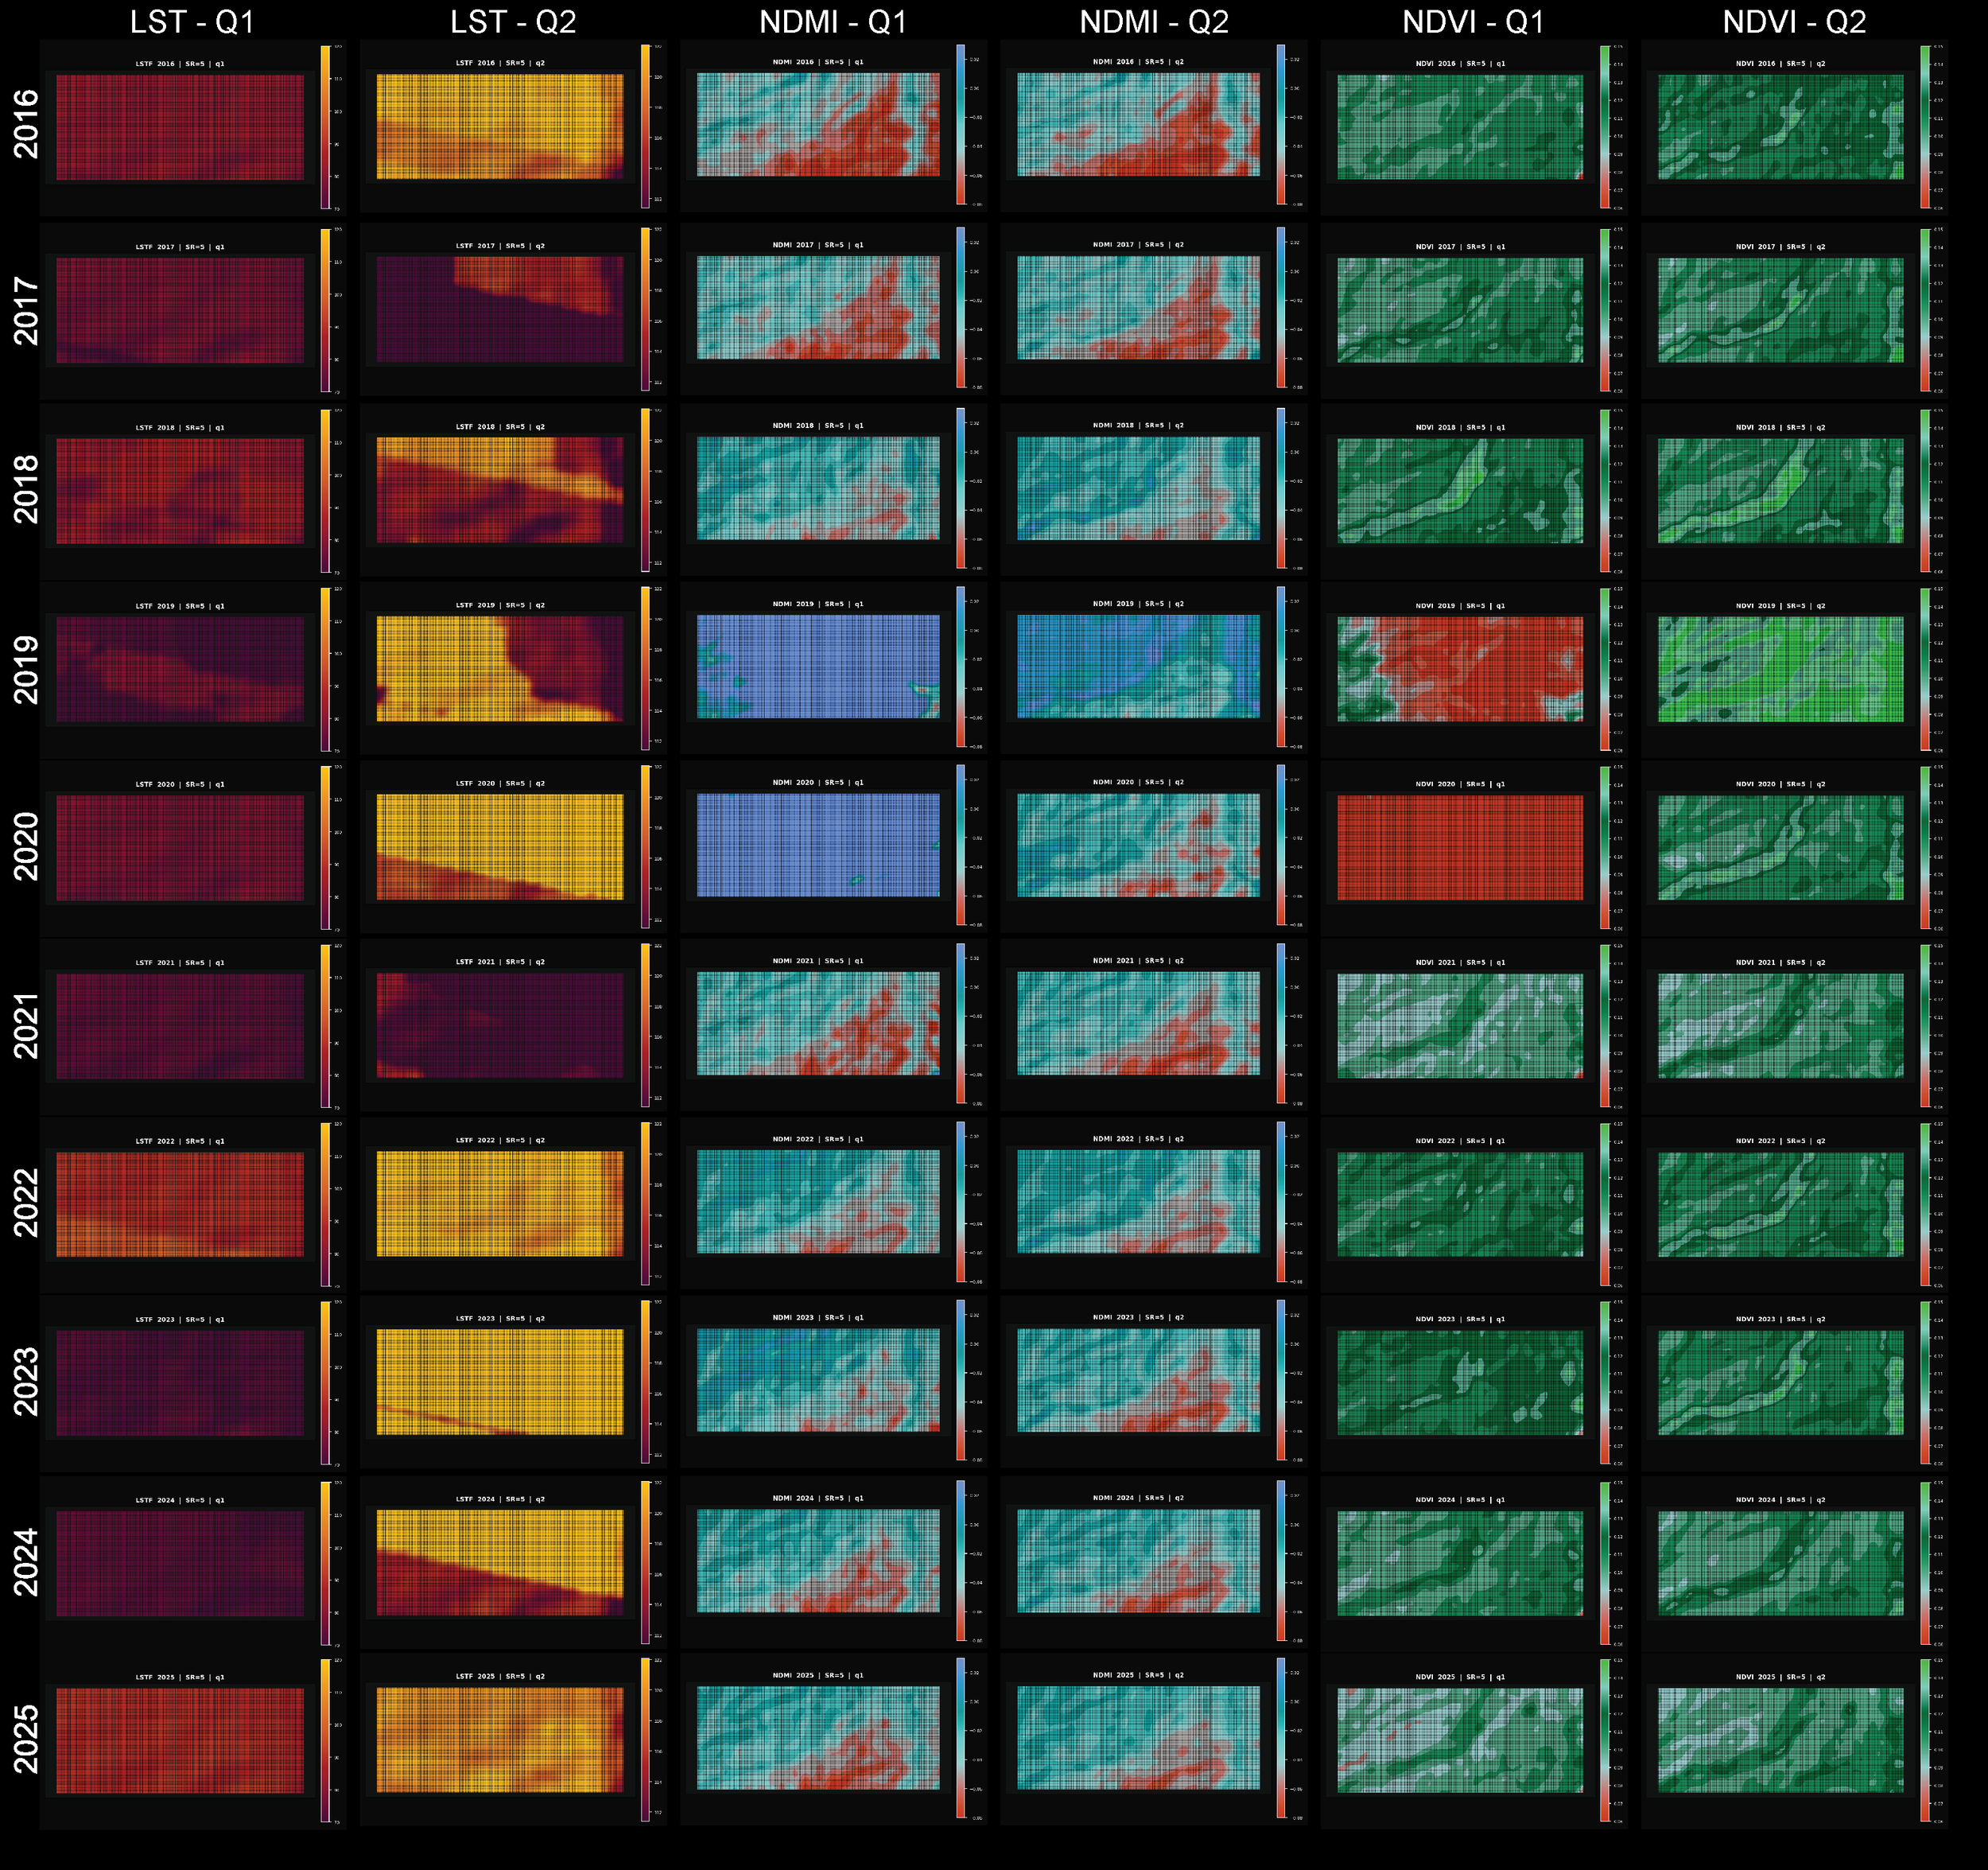
Spatiotemporal Spectral Insights
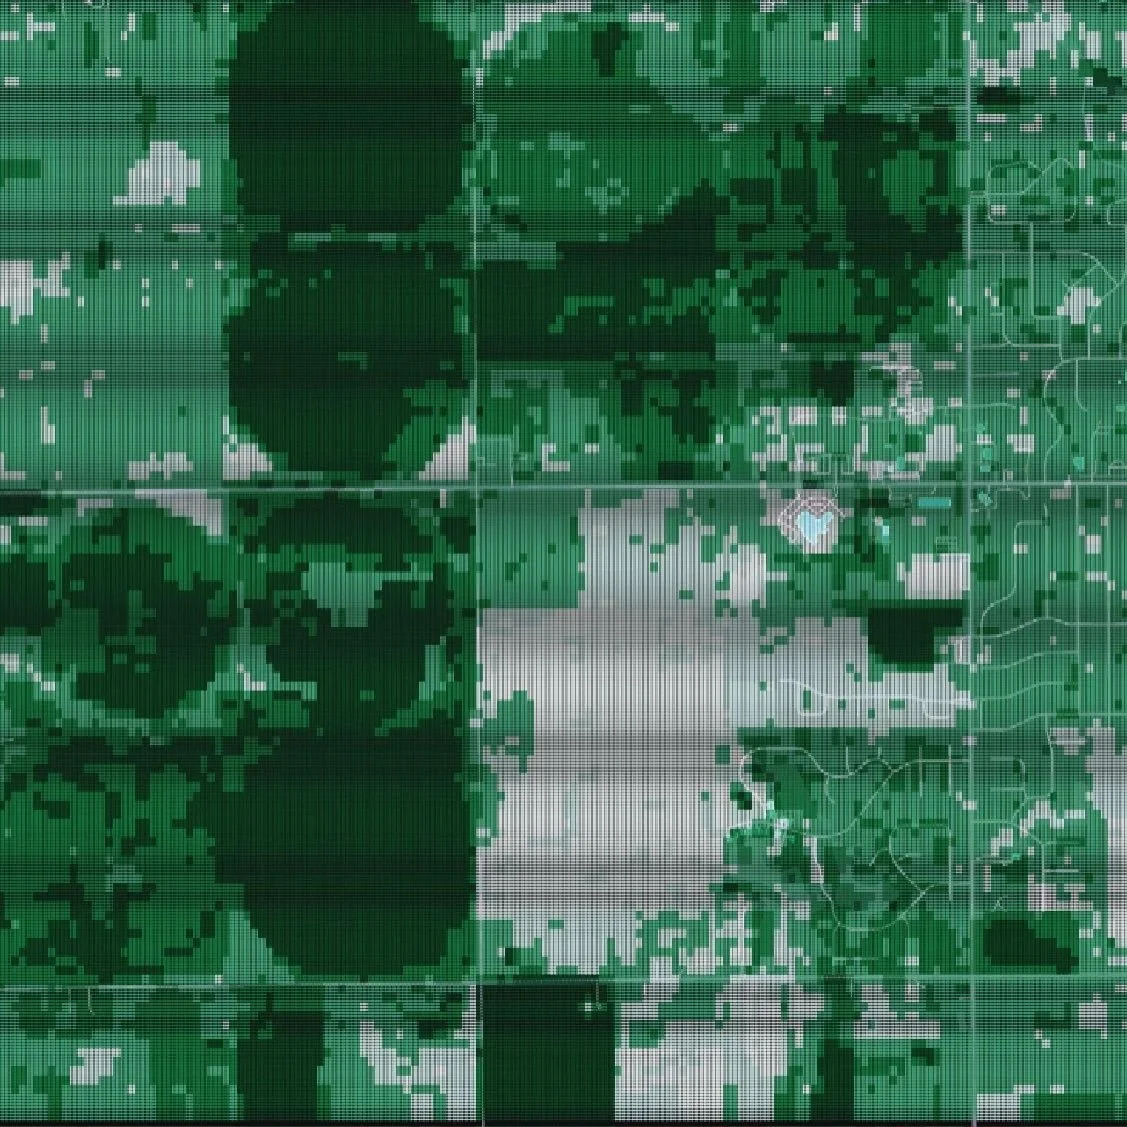

Vegetation (NDVI)
NDVI (Normalized Difference Vegetation Index), measures how much infrared light is reflected by chlorophyll. This measurement allows us to measure spatial and temporal patterns of vegetation health and density.
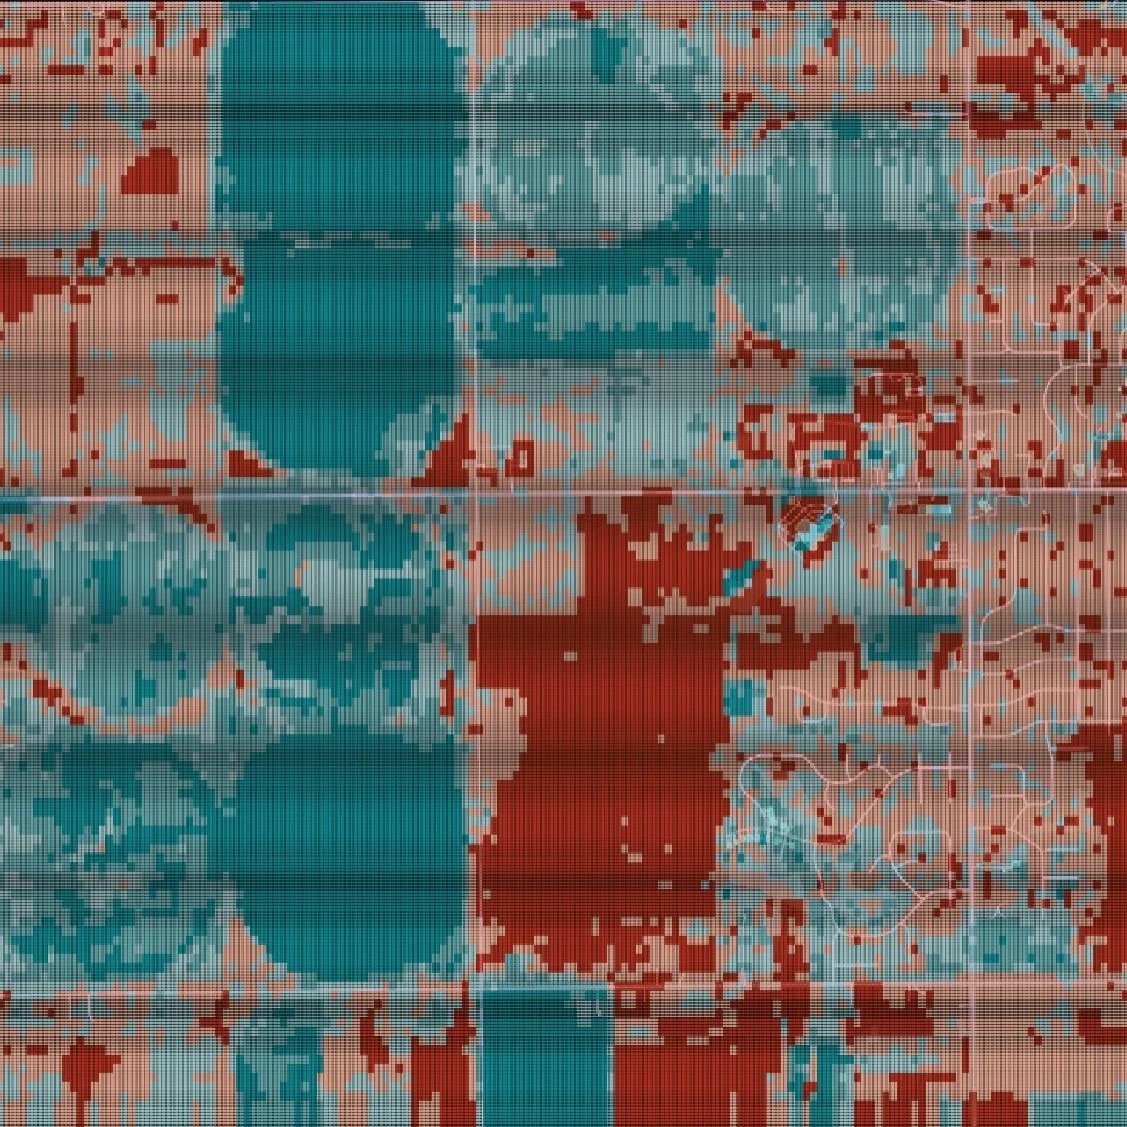

Moisture (NDMI)
NDMI (Normalized Difference Moisture Index) measures the relative moisture content of vegetation by comparing near-infrared and shortwave infrared reflectance. This measurement allows us to assess spatial and temporal patterns of vegetation water stress, canopy moisture, and drought response across a landscape.
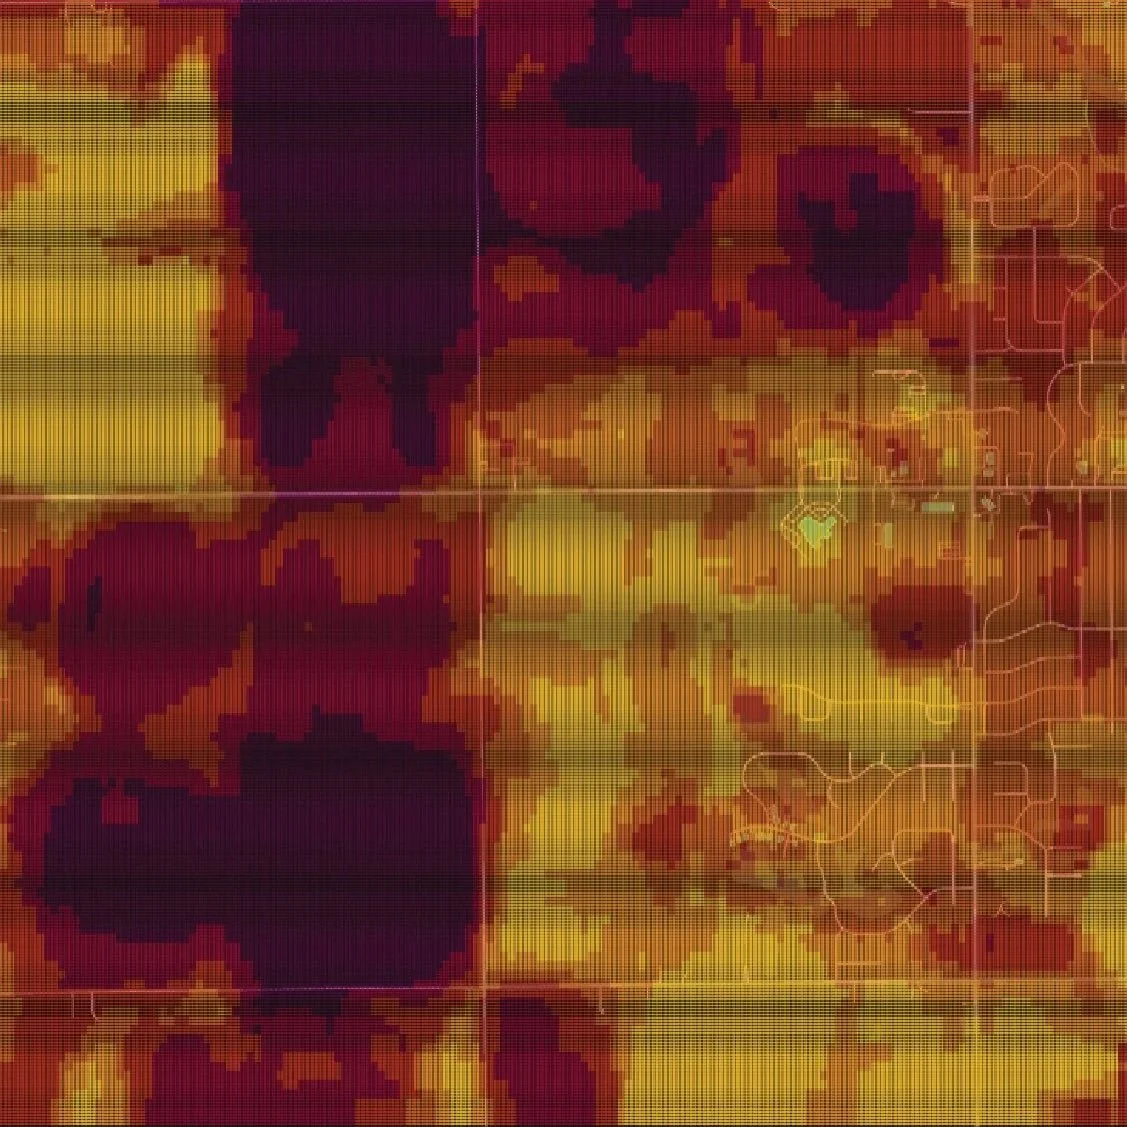

Land Surface Temperature
Land Surface Temperature (°F), derived from the thermal bands of Landsat 8/9 multispectral imagery, is analyzed to reveal both spatial and temporal temperature patterns. Changes are measured year over year at the pixel level to pinpoint areas where a site has warmed or cooled and the correlation between NDVI, NDMI and terrain signals.
Understand annualized and seasonal shifts in land dynamics
Standard DLL analysis periods observe 10 years of multispectral signals providing durable, longitudinal insights and historical benchmarks
Combine Multispectral Signals and 3D Terrain Signals
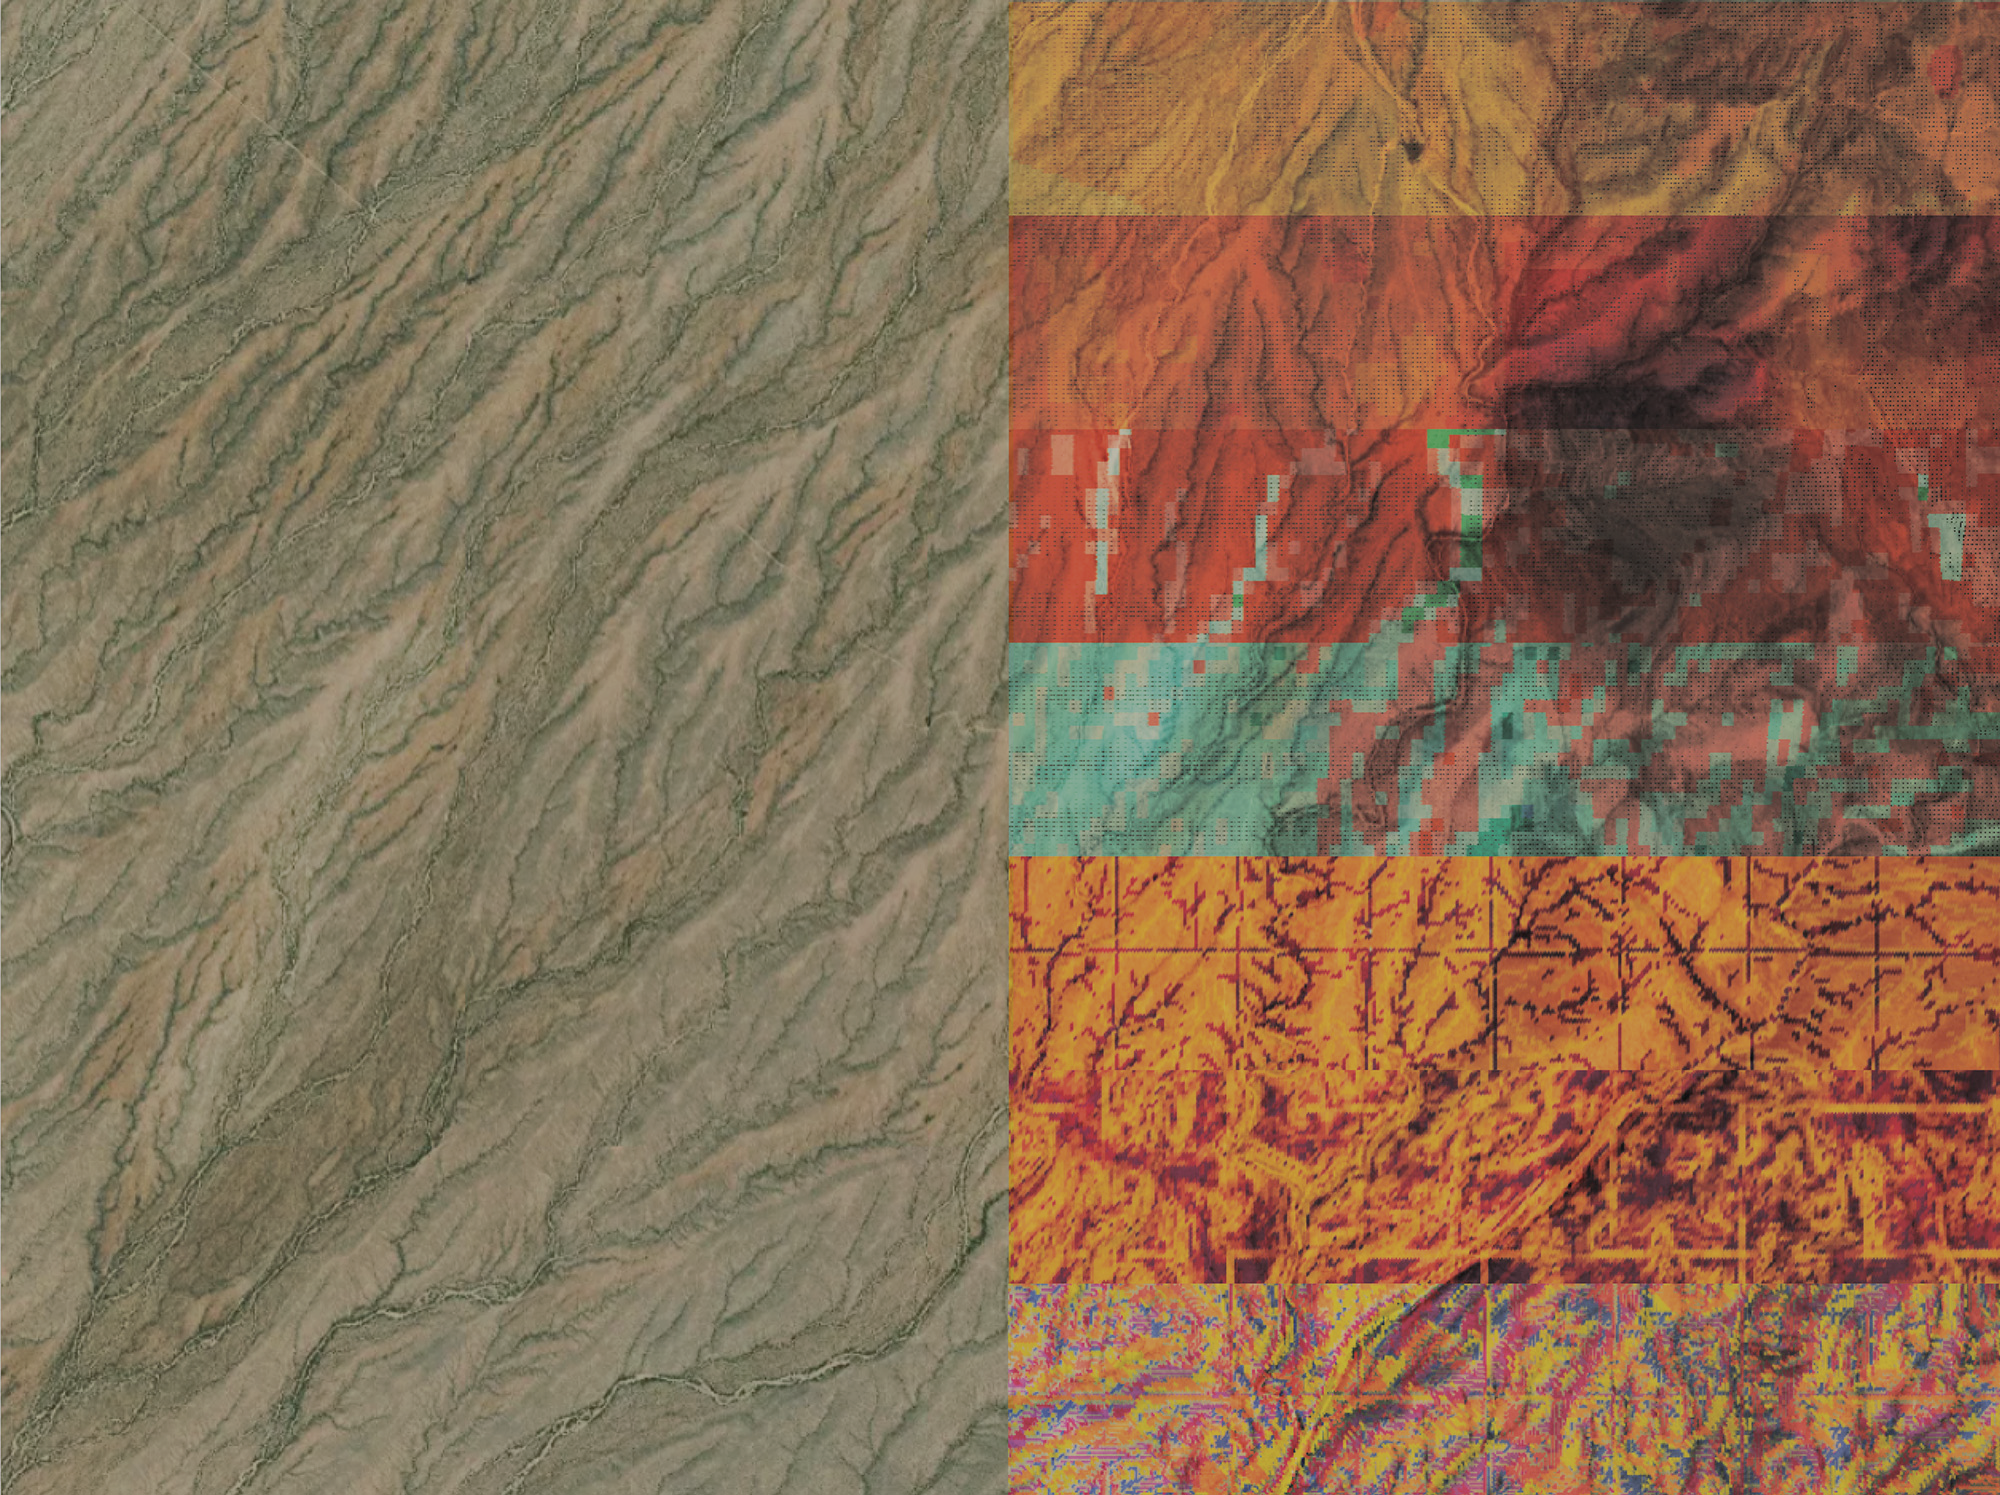
Multispec + LiDAR
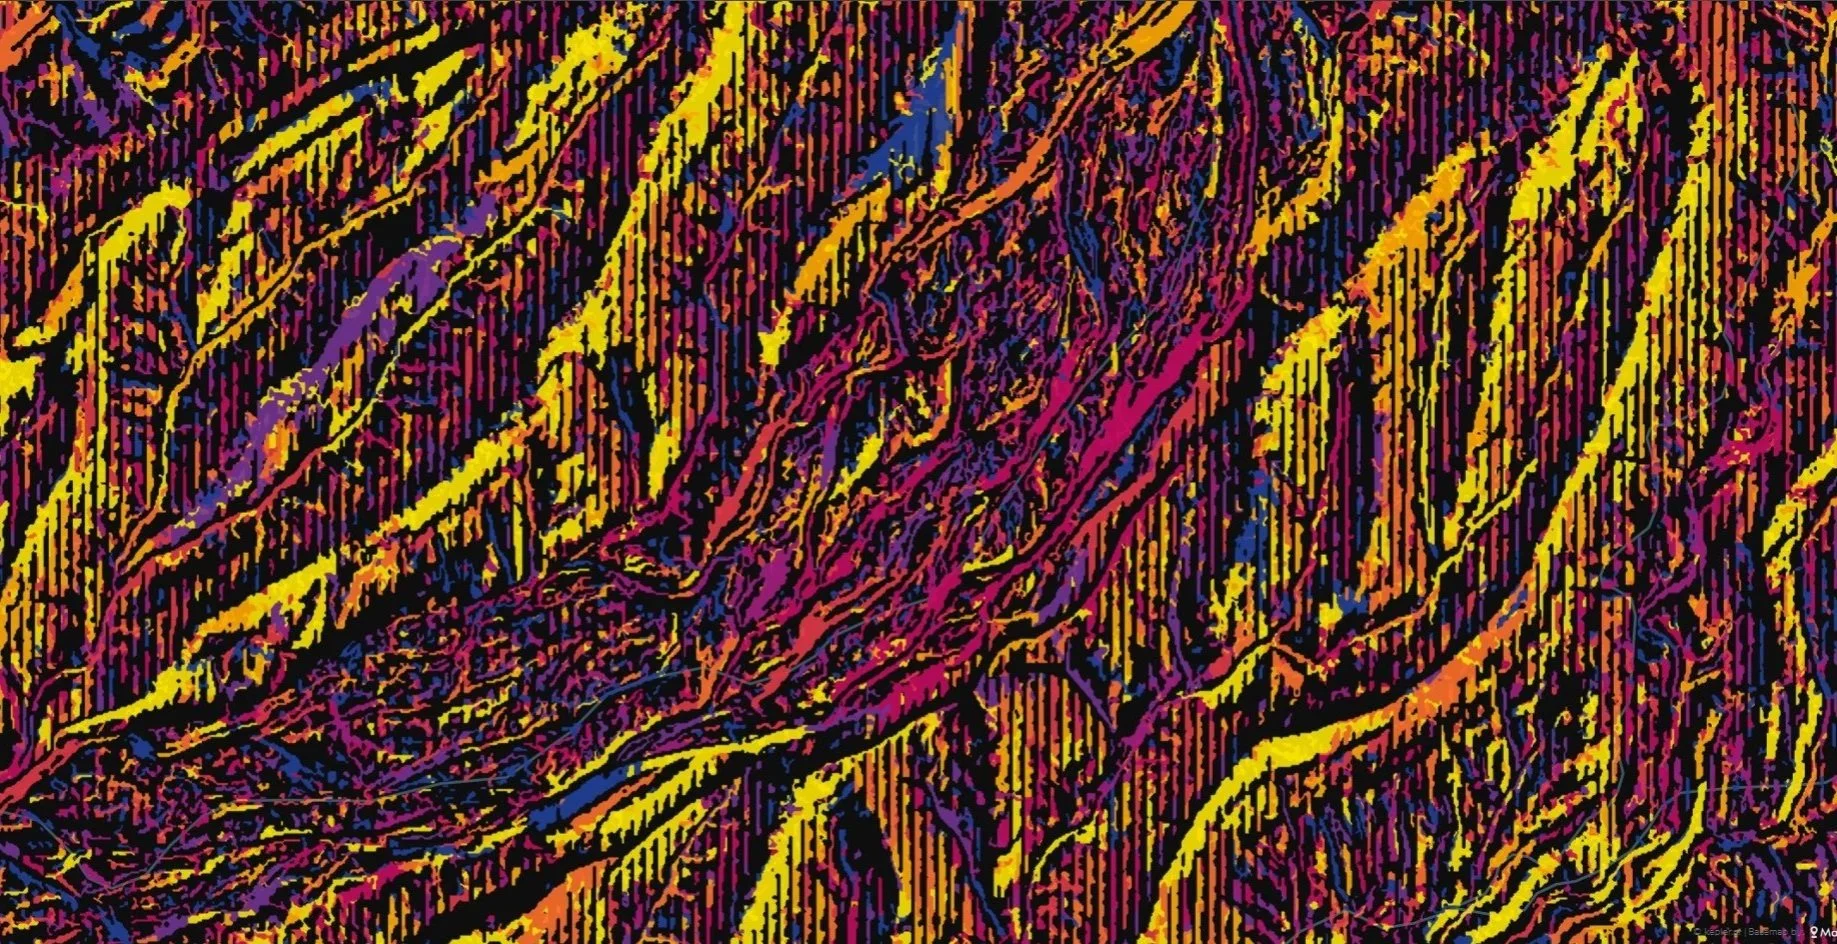
Dynamic Lands Lab integrates multispectral satellite imagery with high-resolution LiDAR terrain analytics to reveal the environmental forces shaping the landscape over time. By combining signals such as NDVI, NDMI, and land surface temperature with 3D terrain intelligence, including drainage behavior, slope directionality, flow convergence, erosion patterns, and ephemeral channel formation. The analysis pipeline uncovers why specific environmental conditions emerge and how they evolve seasonally. This fusion of spectral and terrain-based analysis enables deeper insight into hydrologic behavior, vegetation dynamics, moisture accumulation, and landscape change at both local and watershed scales
Terrain Signals

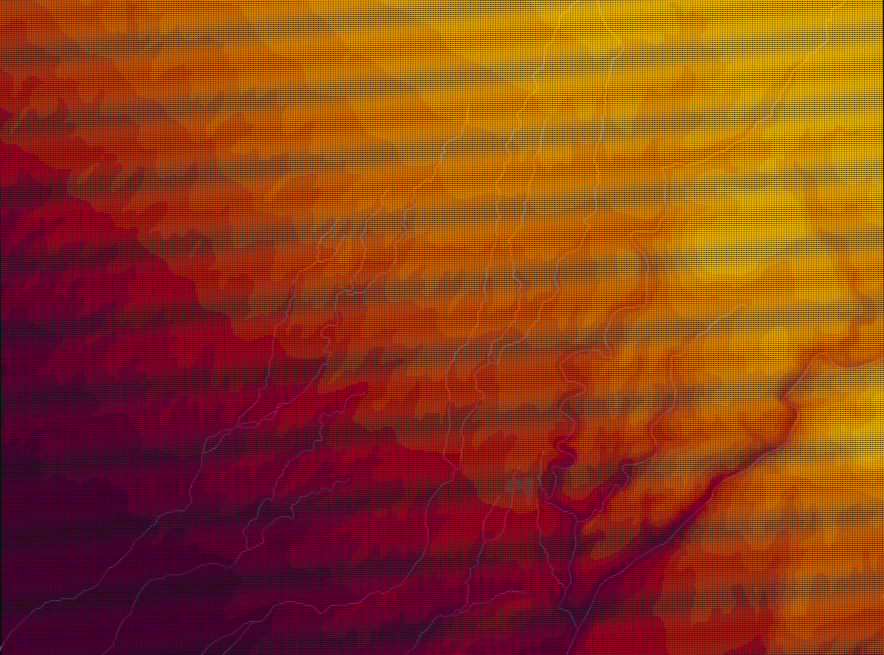
3D Elevation & Slope
Terrain characteristics are analyzed using local directional slope signals derived from USGS 3DEP data. At each location, elevation differences are evaluated across the surrounding neighborhood to capture how terrain changes in multiple directions rather than along a single slope axis.
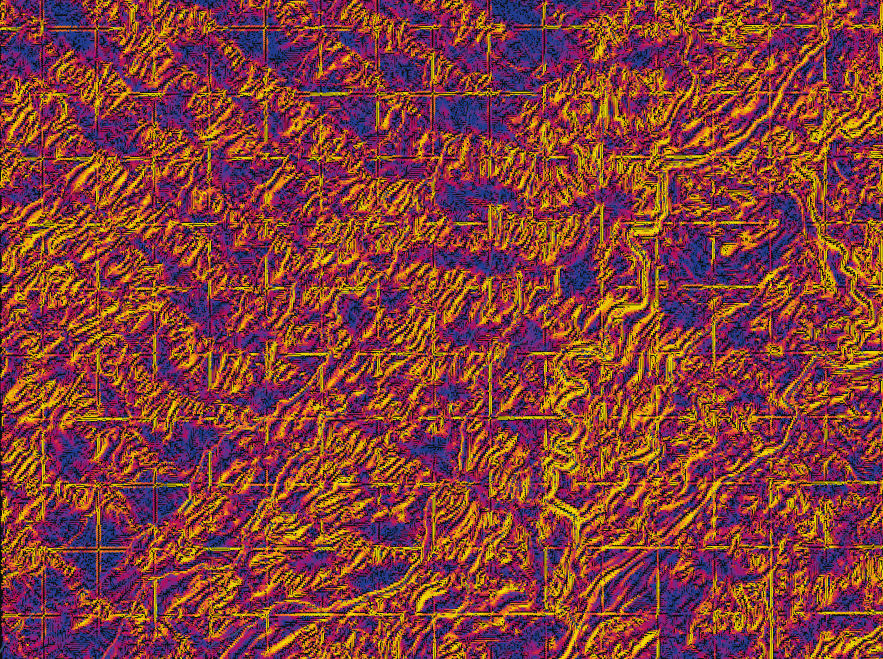
Anisotropy
Directional anisotropy is calculated to describe how organized or diffuse local relief is—distinguishing planar slopes, ridgelines, channels, and isotropic features such as knolls or depressions. This measure reveals whether terrain structure is directionally focused or evenly distributed.
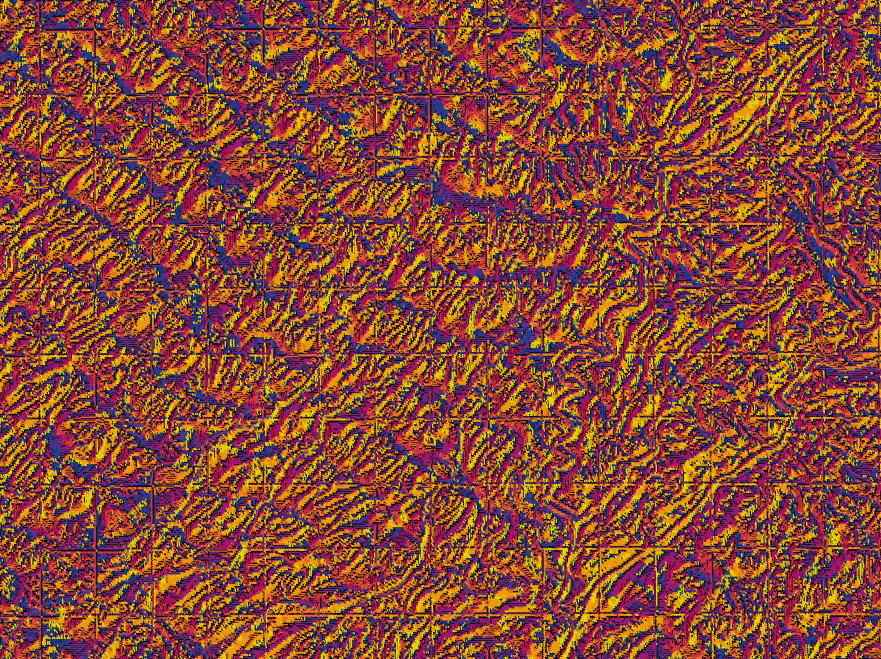
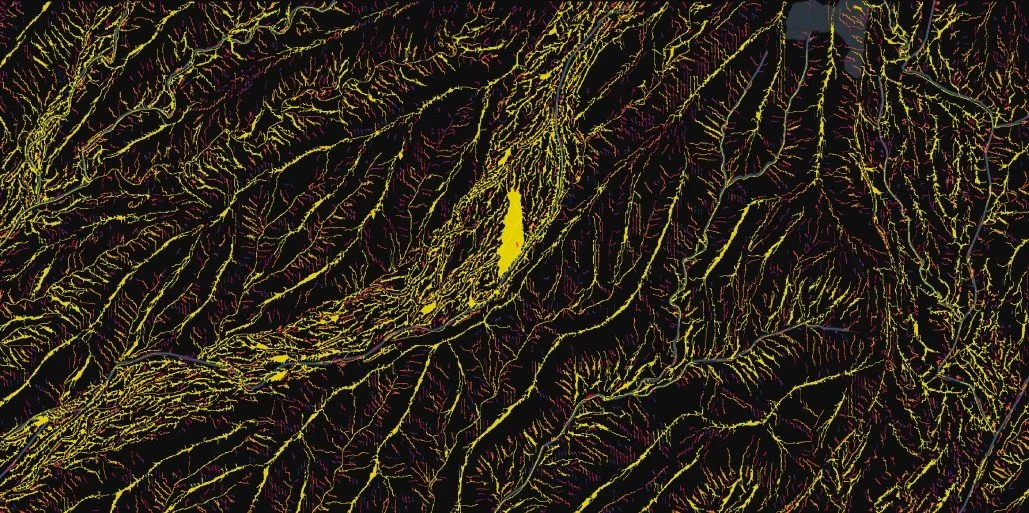
Signal Direction
The dominant slope change direction and angle are extracted from the directional signal to identify the primary orientation of downhill movement, providing insight into flow paths, aspect-driven processes, and terrain-controlled transport.
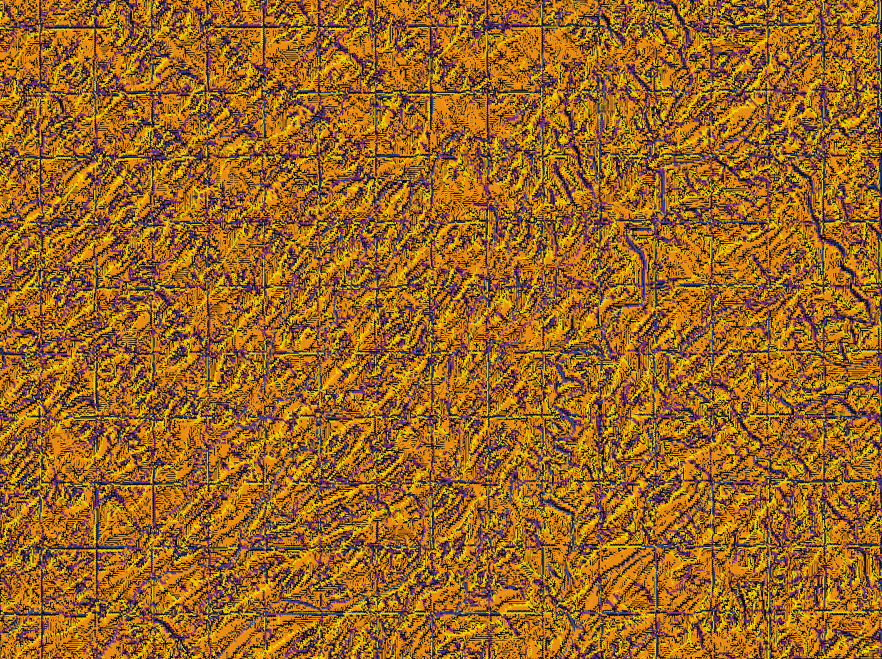
Downhill Fraction
Uphill and downhill fractions quantify how many surrounding directions contribute to descent or ascent, helping to differentiate dispersive surfaces such as ridges from focused flow features such as channels and slope breaks.
Topographic Contours
Map topographical characteristics with topographic contours, segmented from 3D elevation models.
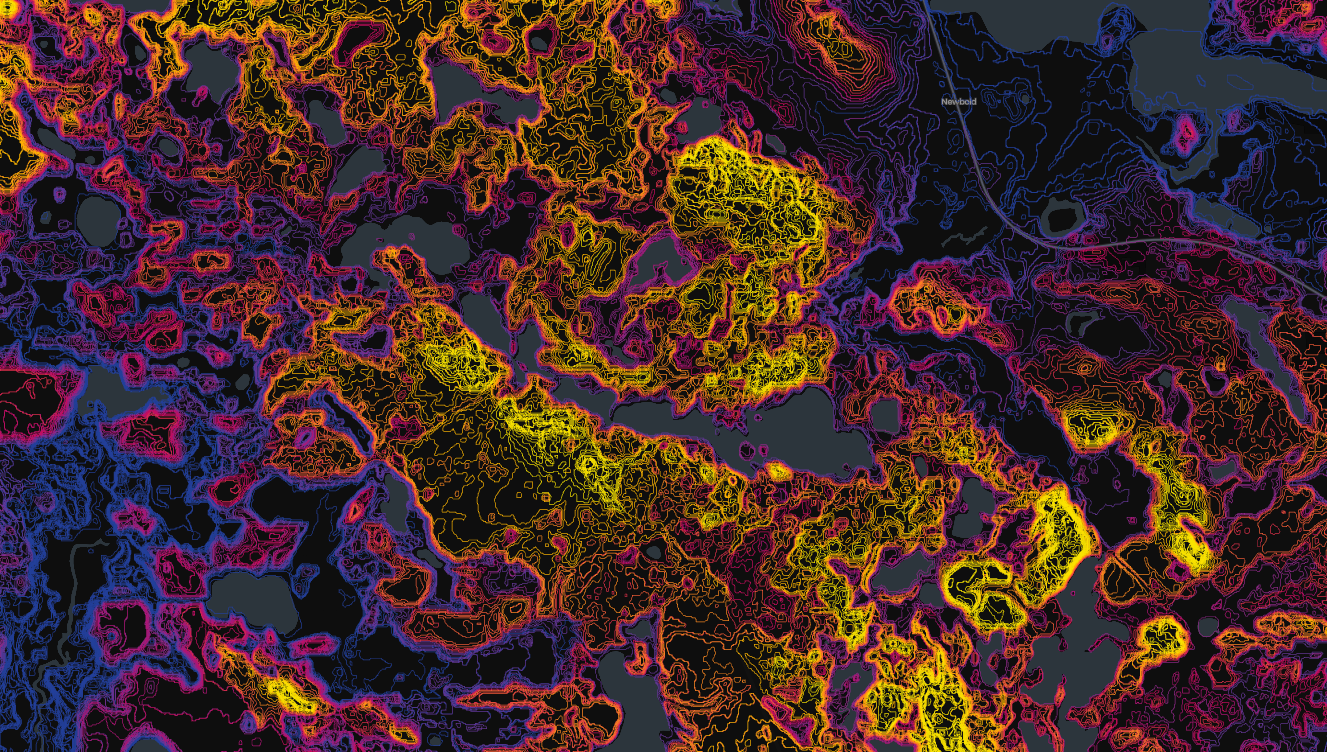
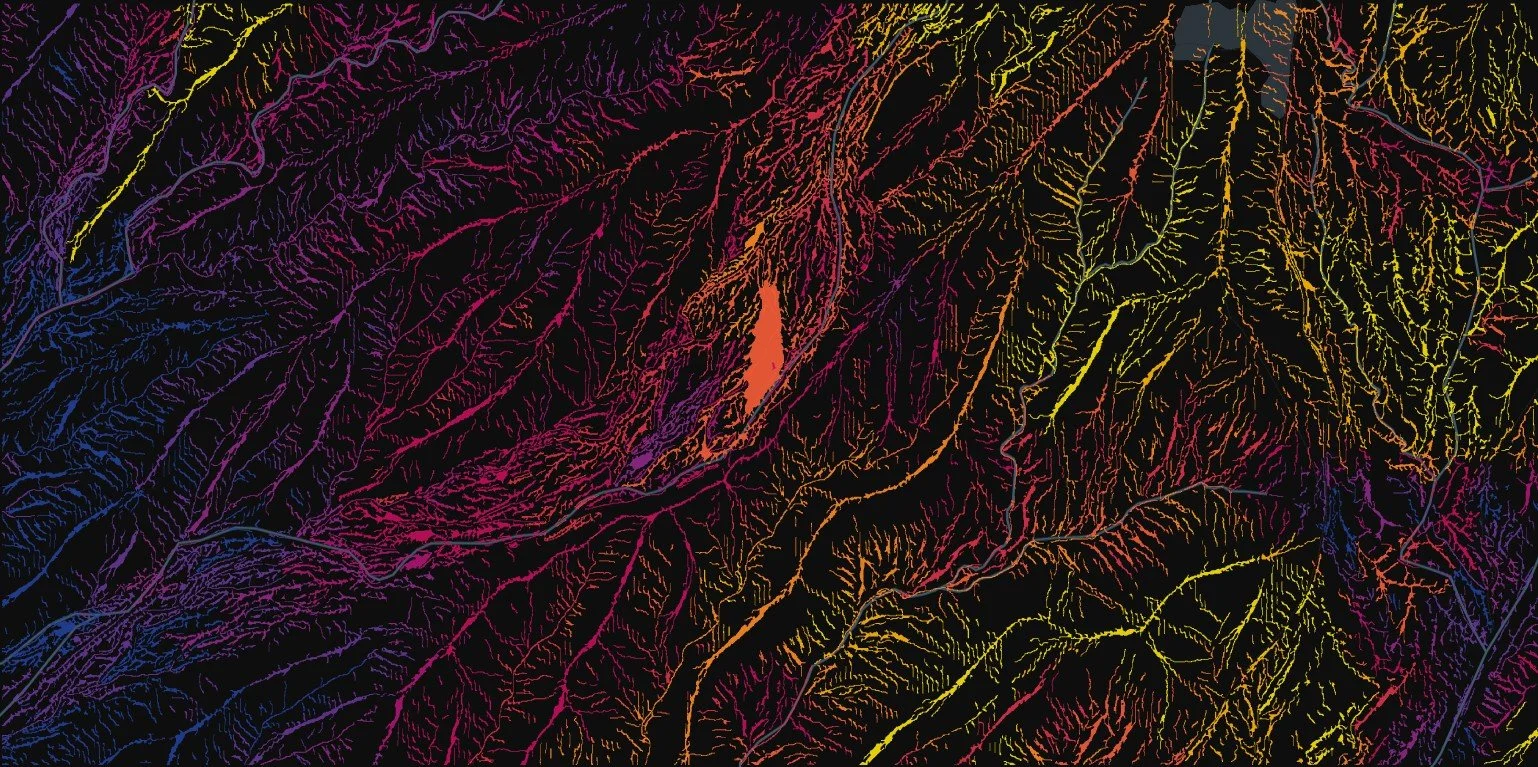
Convergence and Divergence Areas
Downhill-fraction segmentation uncovers water divergence ridges and water convergence areas.
Correlations with Moisture and Vegetation Signals
Understand how watershed characteristics impact moisture retention and vegetation by mapping correlations between multispectral signals with segmented convergence and divergence areas.
Dominant Slope Directions
Map and understand directional signals and the impact on environmental factors such as drainage, wind and erosion.
Topography and Hydrologic
Transform raster data into vector-based segmented layers to uncover topological and hydrologic insights
GIS Data Integration
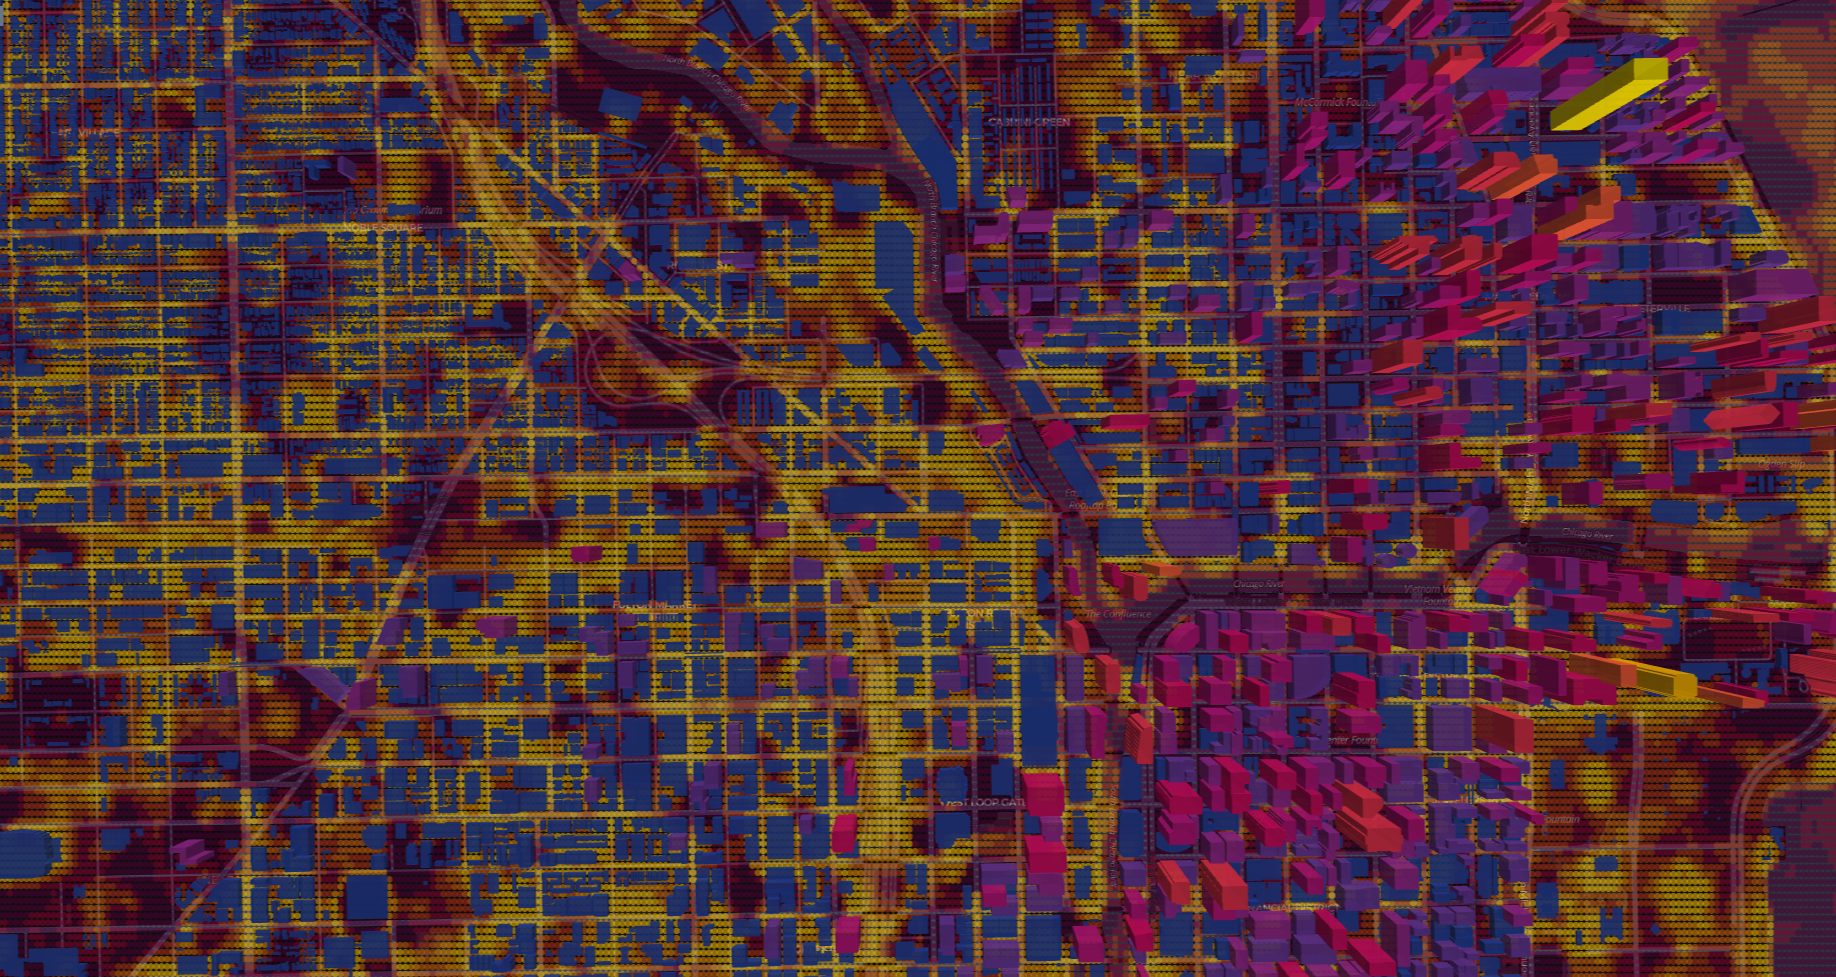
Structures
Dynamic Lands Lab integrates open-source GIS data to map and analyze surrounding context for any site. Our platform compiles information on existing structures, active construction sites, hospitals, and other critical facilities to quantify proximity and relationships within the built environment. We measure distances to nearby assets and generate aggregated summaries that reveal what surrounds your location. Estimated building footprints and massing models are provided in both GeoJSON and OBJ formats, enabling clients to interactively explore surrounding infrastructure through the web app or seamlessly integrate it into 3D design environments.
Extreme Weather Events
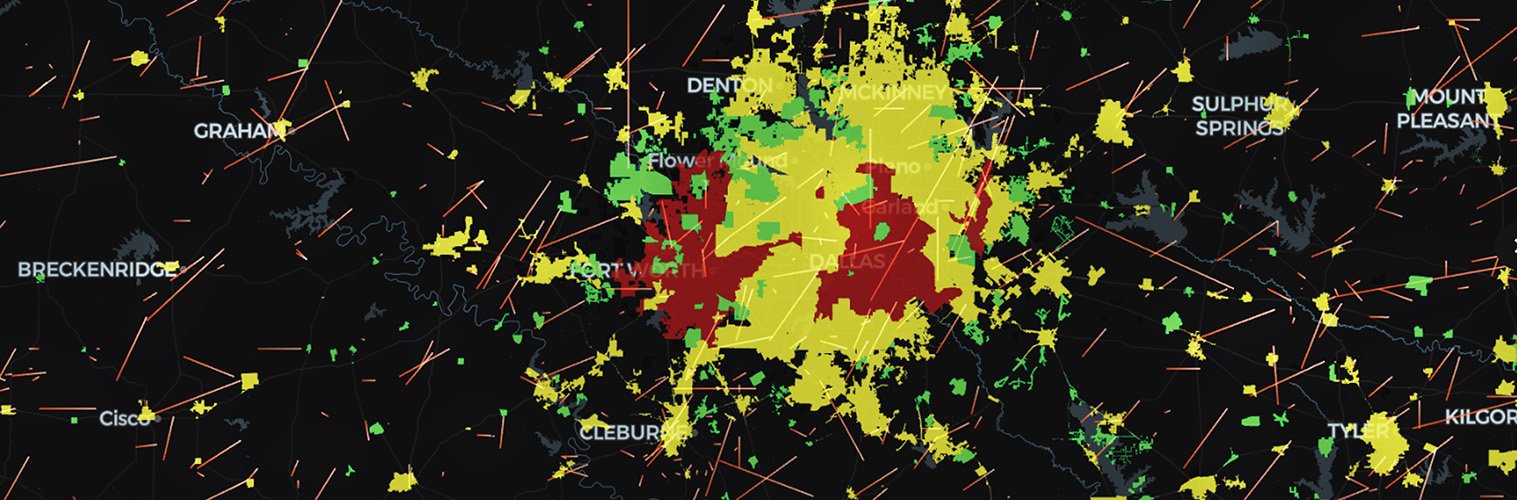


High Winds
Tornados
Hail
Dynamic Lands Lab analyzes historical patterns of extreme weather events including tornadoes, high winds, and hail to help clients understand environmental risk over time. Using spatial and temporal aggregation, we quantify the frequency, intensity, and proximity of severe weather occurrences affecting your site and its surrounding region. These insights reveal long-term exposure trends, enabling more informed decisions related to resilience planning, design mitigation, and operational risk management.