Dynamic Lands Lab Web App

A digital scientific dashboard displaying a 3D terrain map, various graphs, and data metrics related to land surface temperature, moisture levels, and land cover summary.

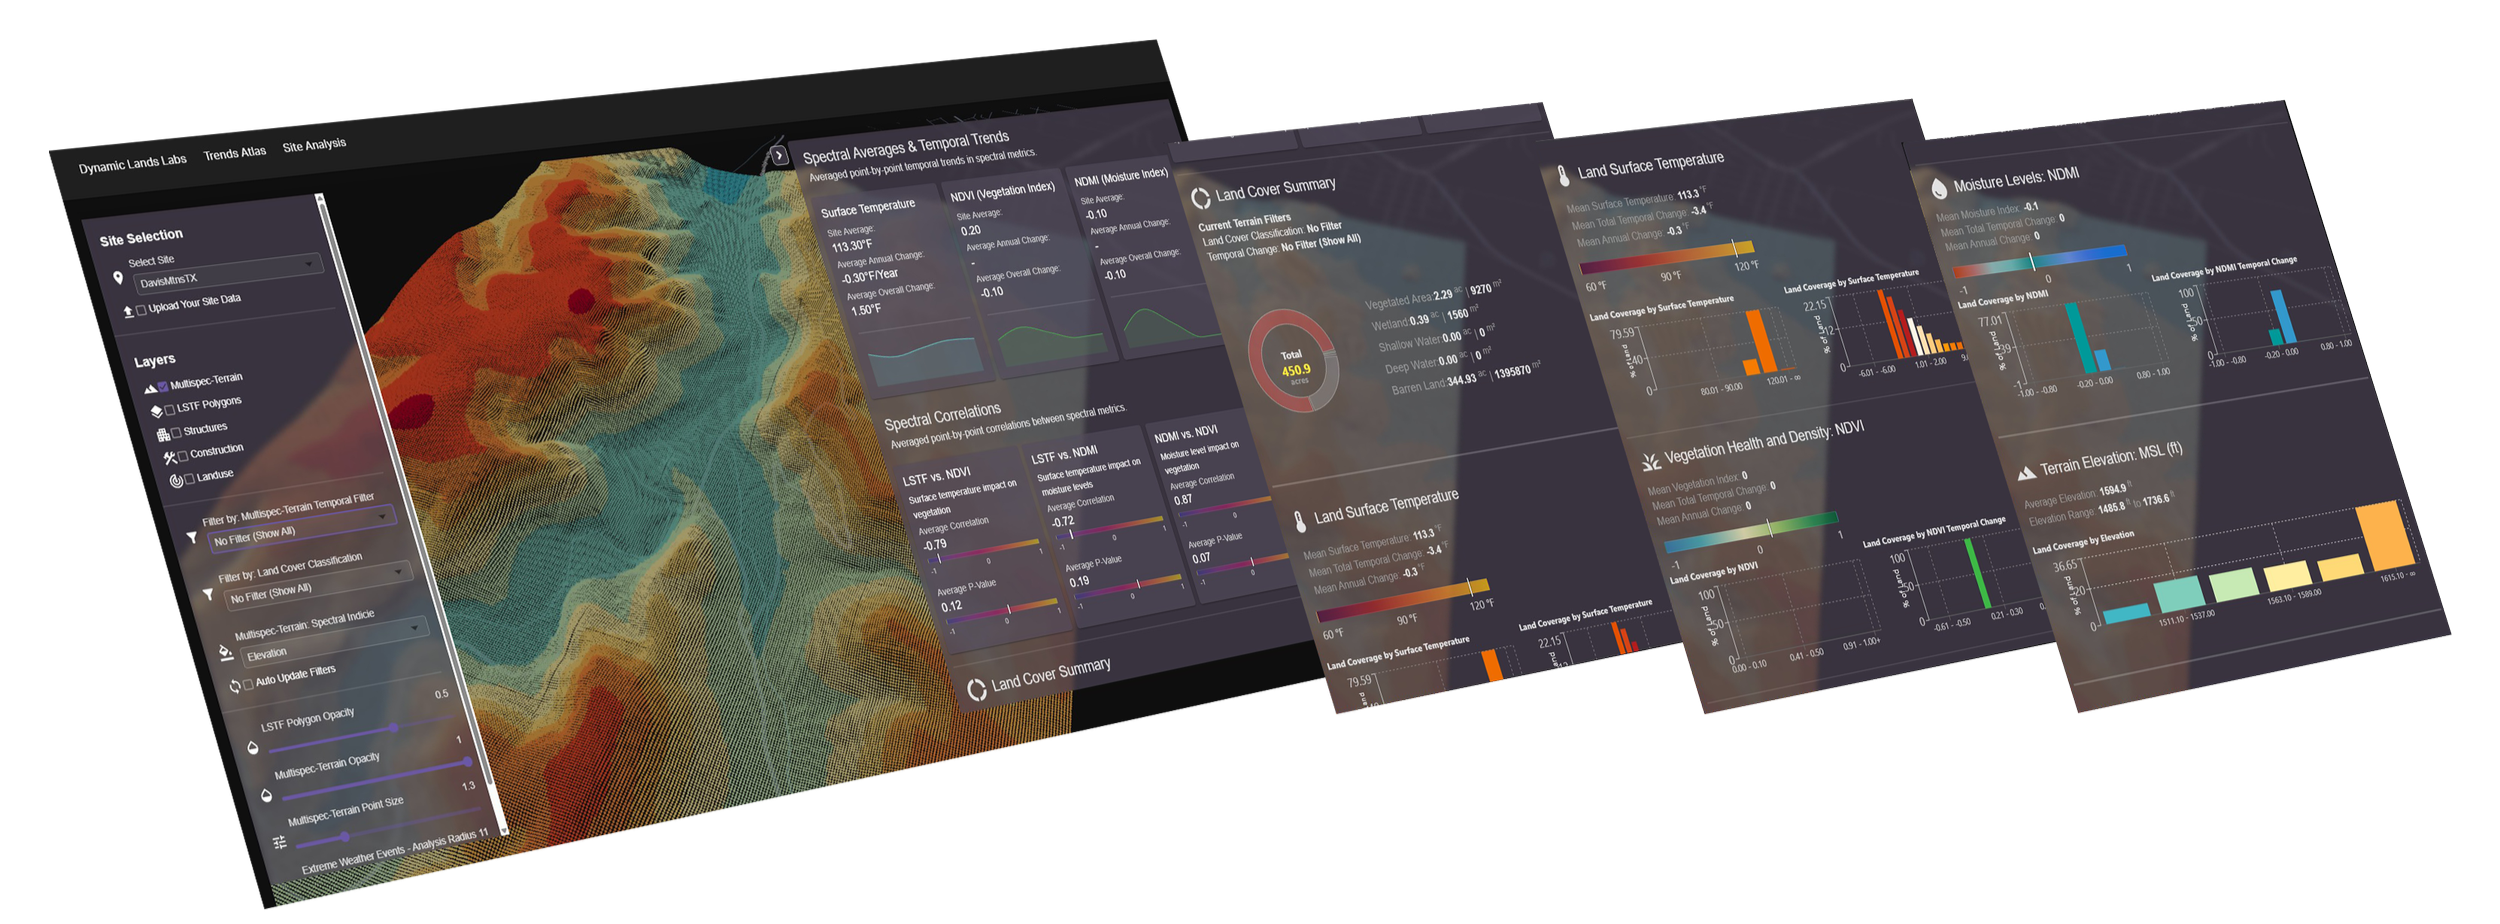
Interactive data visualization tools that let you explore your preprocessed site data in your browser

Try the web app

A computer screen showing a data upload interface for a site selection tool, with files being selected from a desktop folder named 'data' on a Windows operating system.

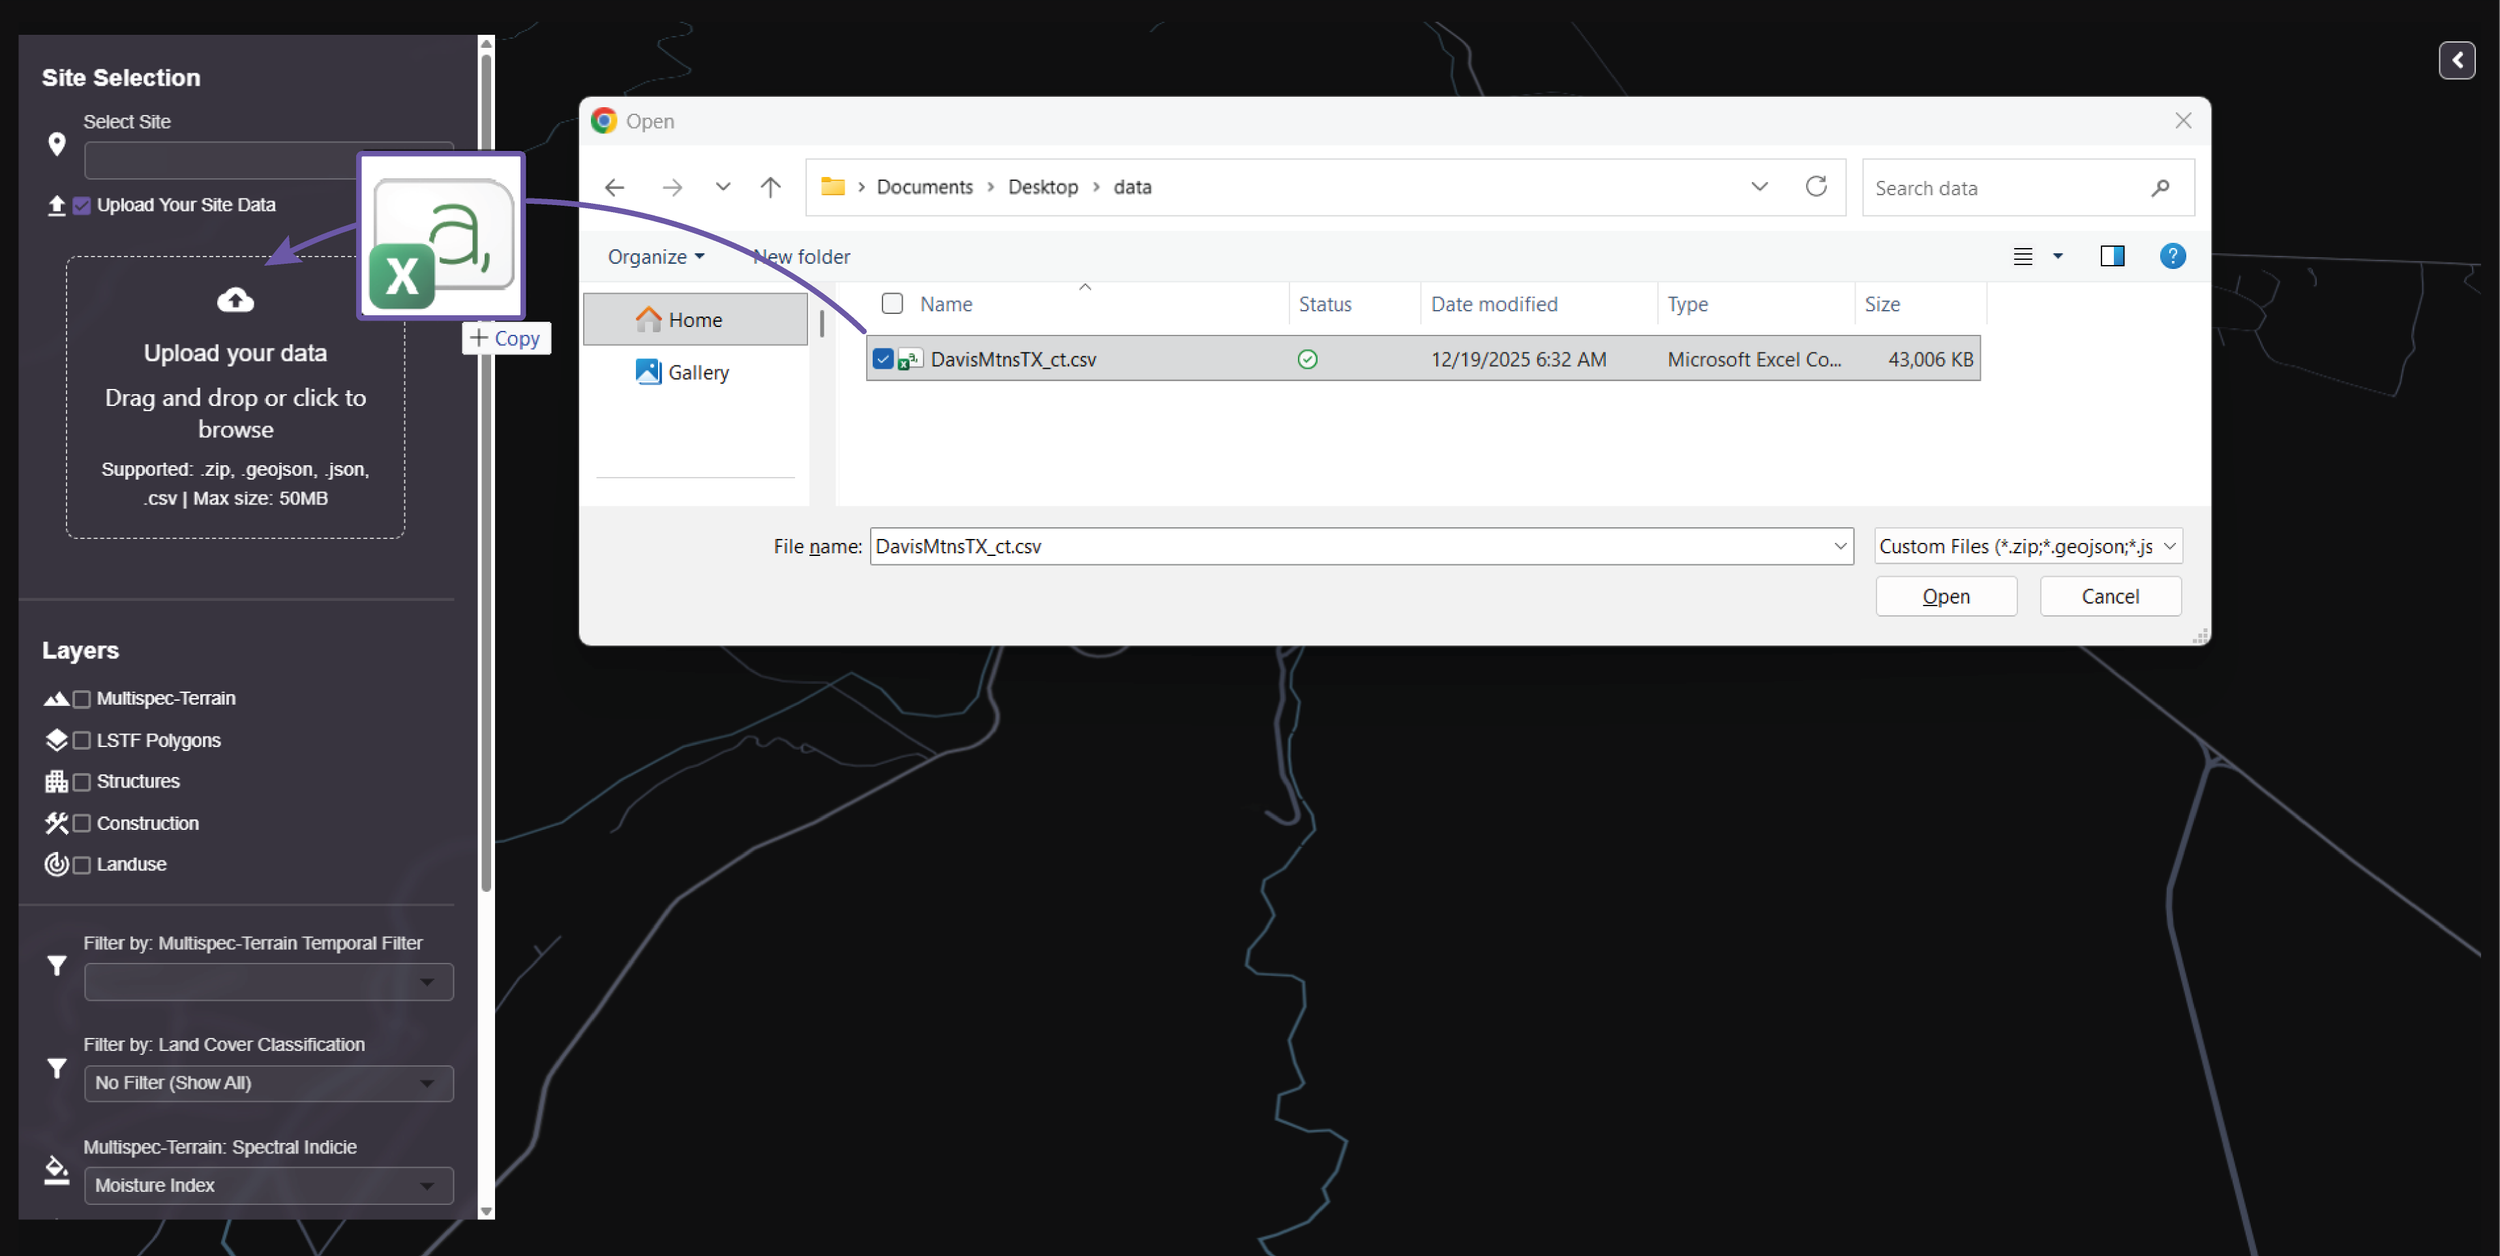
Upload your preprocessed site data files

Landscape of a map editing software interface showing a site selection menu with three options: DavisMtnsTX, MildredLakeWI, and Haysvllieks, with the DavisMtnsTX option highlighted.

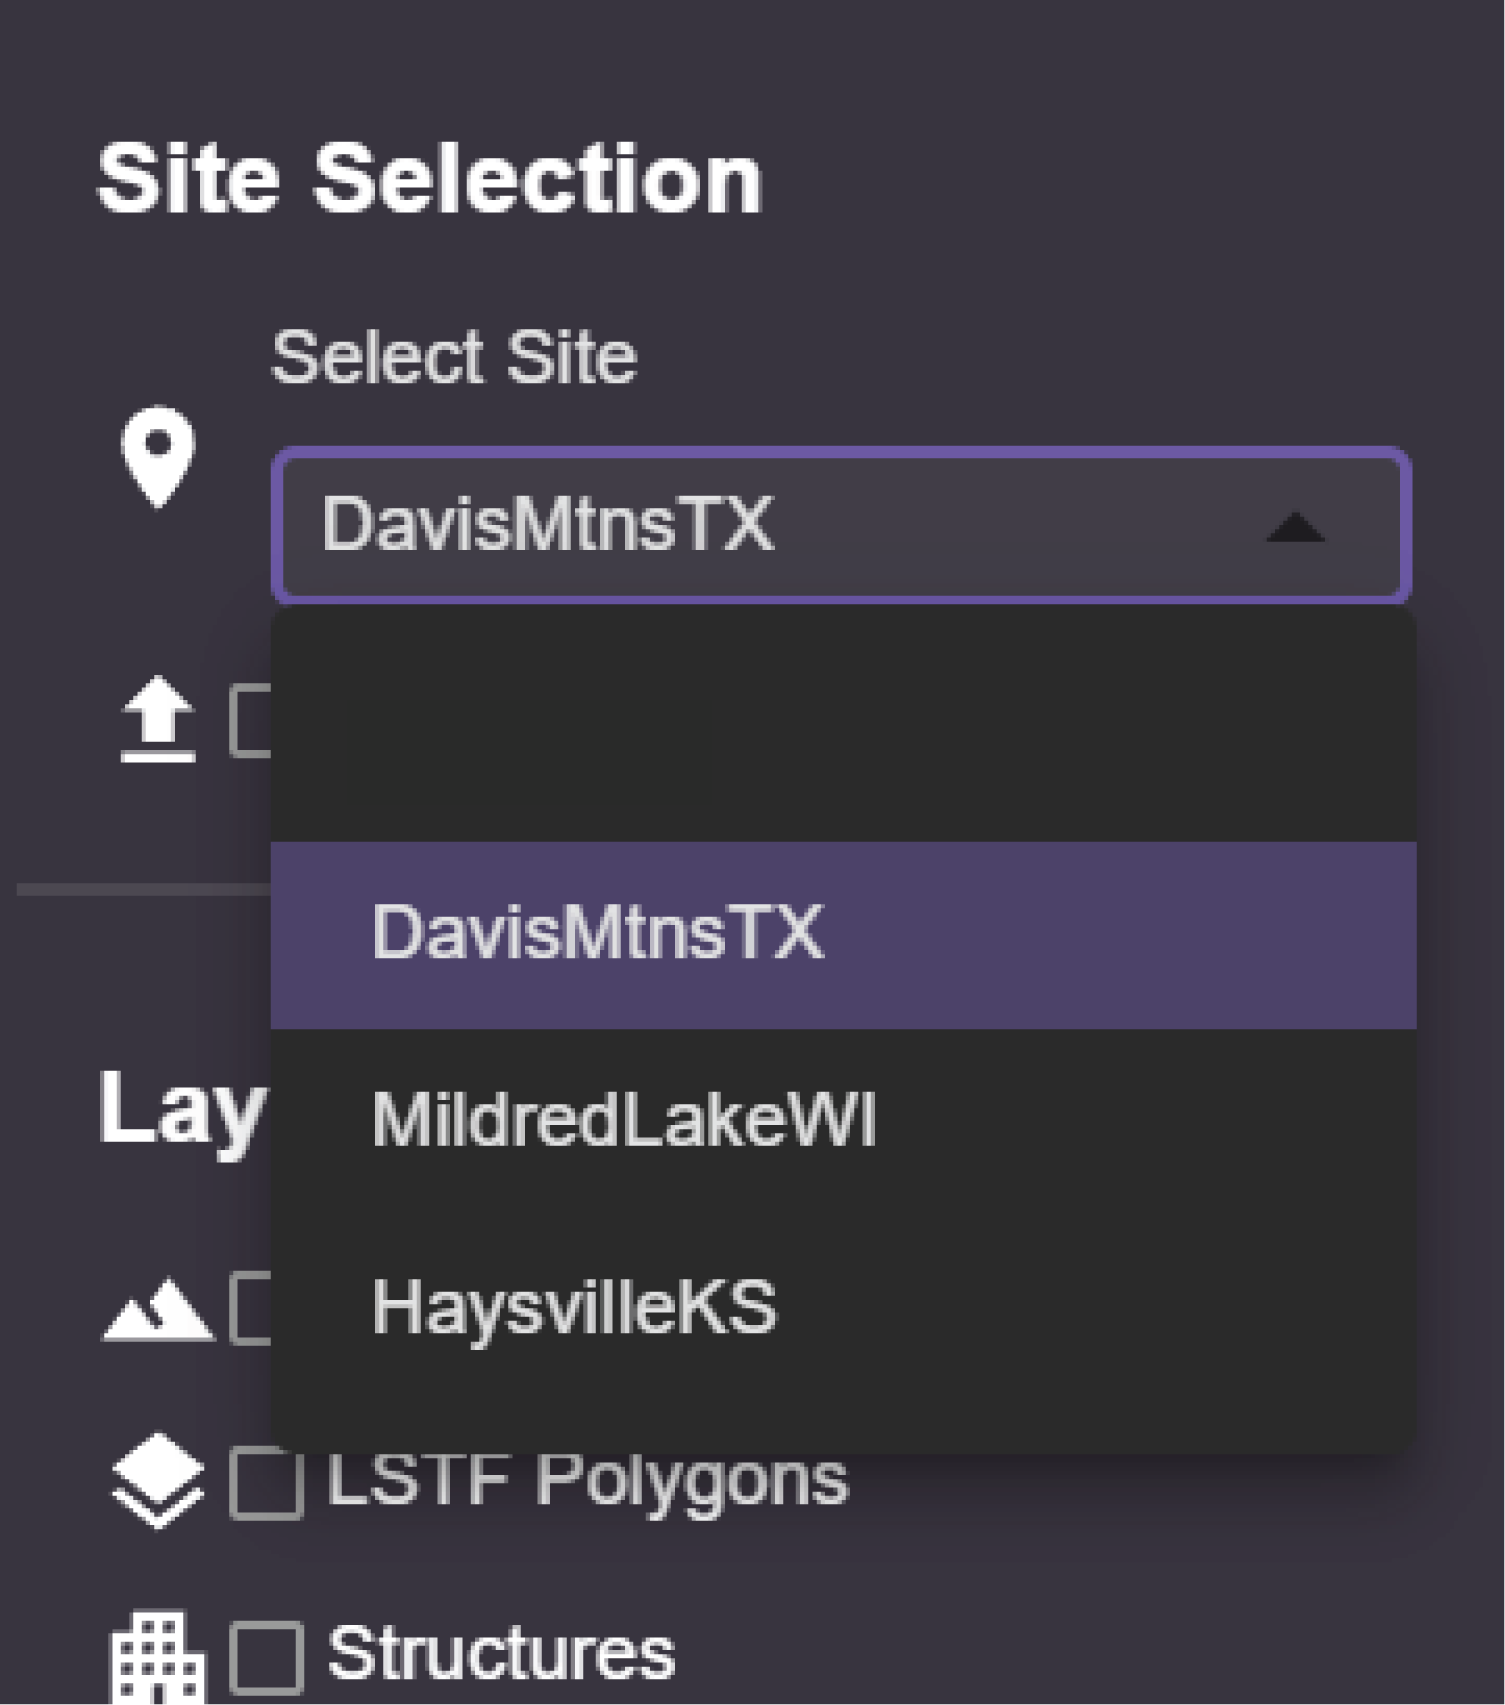
Toggle between multiple uploaded sites

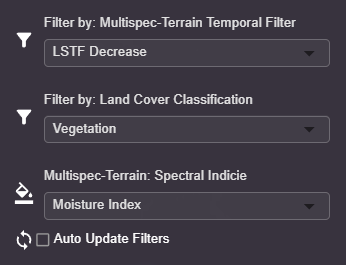
Filter and, overlay and compare spatiotemporal data

Screenshot of a software interface showing filter settings for terrain analysis, including options for multispectral terrain, land cover classification, spectral indices, and moisture index.